


Quantitative FTIR Analysis: Laboratory Applications of the Beer–Lambert Law
January 19, 2026
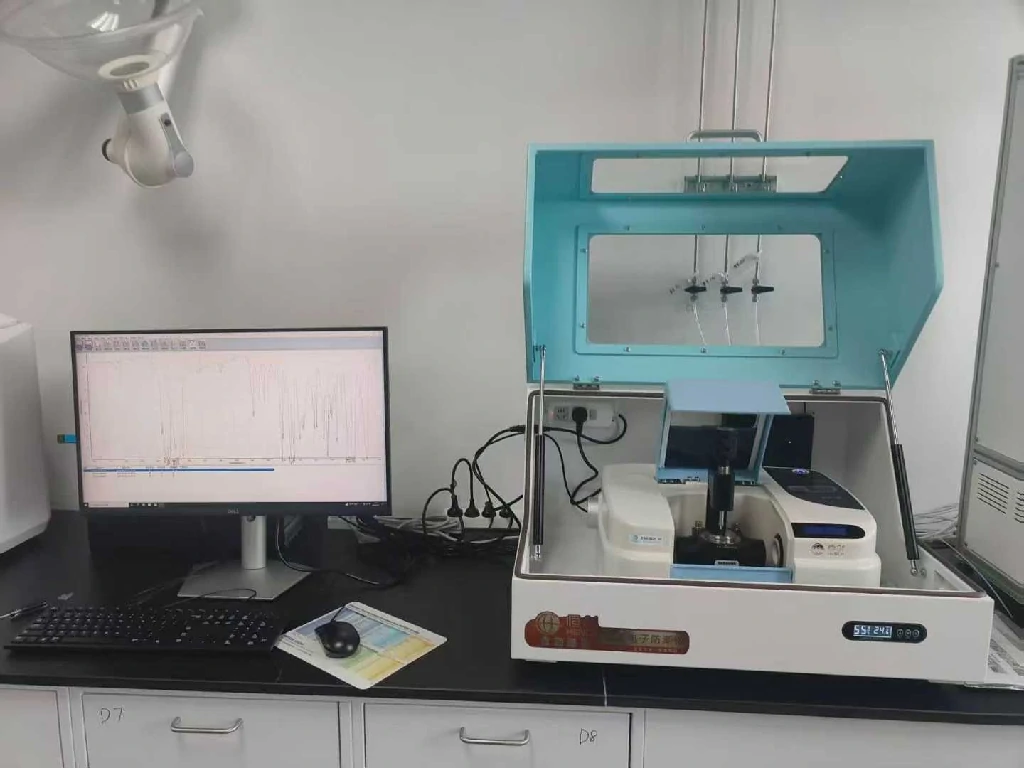
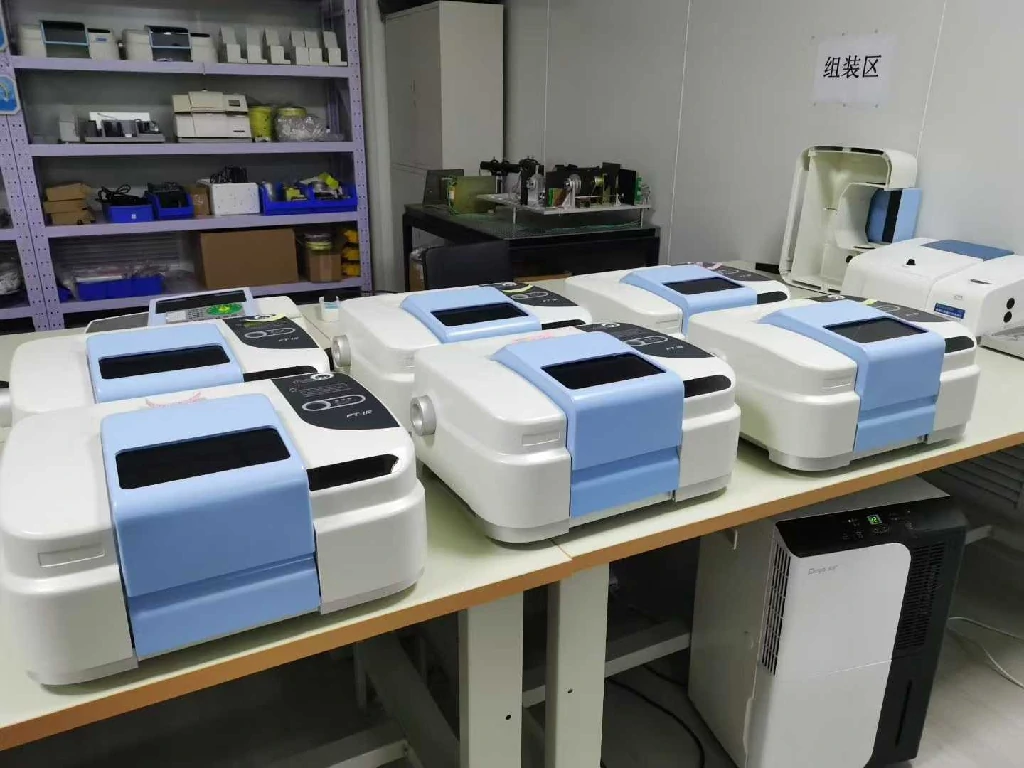
Fourier Transform Infrared Spectroscopy (FTIR) is widely used in modern laboratory analysis due to its rapidity, non-destructiveness, and ability to handle multiple sample phases. Quantitative FTIR, based on the Beer–Lambert Law, enables precise determination of component concentrations in solid, liquid, and gaseous samples. This technique is commonly applied in organic chemistry, materials science, pharmaceuticals, food quality control, and environmental monitoring. This article provides a systematic overview of the principles, methods, applications, and key operational considerations for quantitative FTIR, offering practical guidance for standardized laboratory procedures.
I. Core Principles of the Beer–Lambert Law in FTIR
The Beer–Lambert Law establishes a linear relationship between light absorption, sample concentration, and optical path length, forming the basis for quantitative spectral analysis. In FTIR, adaptations are needed to account for infrared light characteristics and sample states.
1.1 Key Formulas
Molar absorption form (liquid and gas samples): A=εbcA = \varepsilon bcA=εbc
- AAA: Absorbance after baseline correction
- ε\varepsilonε: Molar absorptivity (L⋅mol−1⋅cm−1\mathrm{L\cdot mol^{-1}\cdot cm^{-1}}L⋅mol−1⋅cm−1)
- bbb: Path length (cm)
- ccc: Analyte molar concentration (mol⋅L−1\mathrm{mol\cdot L^{-1}}mol⋅L−1)
Mass absorption form (solid samples): A=abcA = abcA=abc
- aaa: Mass absorption coefficient (cm2⋅g−1\mathrm{cm^2\cdot g^{-1}}cm2⋅g−1)
- ccc: Mass concentration of the analyte (g⋅cm−3\mathrm{g\cdot cm^{-3}}g⋅cm−3)

1.2 Prerequisites for Quantitative FTIR
To achieve reliable quantitative results, the following conditions should be met:
- Monochromatic approximation: Select narrow wavenumber ranges (±2 cm⁻¹) for characteristic peaks to simulate monochromatic light conditions.
- No light loss: Samples must be uniform and free from scattering or turbidity.
- Stable absorption coefficient: Avoid interactions with solvents/matrices or self-aggregation of analytes.
- Optimal absorbance range: Maintain characteristic peak absorbance between 0.2–2.0 to ensure linearity.
- No overlapping peaks: Ensure analyte peaks do not overlap with background or matrix absorption.
II. Quantitative FTIR Methods in the Laboratory
The choice of method depends on sample complexity, analyte quantity, and required accuracy.
2.1 Calibration Curve Method (External Standard)
- Establish a linear calibration curve using standards with known concentrations.
- Measure absorbance of the unknown sample and calculate concentration from the curve.
- Advantages: Simple, low computational load, suitable for high-throughput analyses.
- Applications: Single-component samples, determination of water content in solvents, methanol impurities in ethanol.
2.2 Internal Standard Method
- Introduces a stable internal standard to correct systematic errors.
- Uses absorbance ratios for calibration, improving accuracy.
- Applications: Complex matrices, polymer additives, active pharmaceutical ingredients, solid samples.
2.3 Standard Addition Method
- Adds known amounts of analyte to the unknown sample to mitigate matrix effects.
- Applications: Trace impurities in polymers, environmental water samples, residual monomers.
2.4 Deconvolution and Peak Fitting
- Separates overlapping peaks using FTIR software and mathematical fitting.
- Applications: Multi-component analysis of copolymers, petroleum hydrocarbons, complex organic mixtures.

III. Typical Laboratory Applications
Organic Chemistry
- Trace moisture detection in solvents using O-H stretching peaks (~3400 cm⁻¹).
- Purity analysis of raw materials by comparing main component peaks with impurity peaks.
Materials Science
- Quantitative analysis of copolymer composition and polymer additives.
- Use internal standard or standard addition methods to account for matrix effects.
Pharmaceuticals
- Determination of active ingredients in tablets, capsules, and preparations without dissolution.
- Homogeneity testing of formulations through non-destructive analysis.
Food and Environmental Analysis
- Rapid quantification of fats, proteins, and carbohydrates in food samples.
- Detection of airborne VOCs, CO₂ in industrial emissions, petroleum hydrocarbons in soil, and phenols in water.
Inorganic Chemistry
- Quantification of inorganic anions (e.g., carbonates, nitrates) and coordination compounds using solid sample KBr pellet preparation.
IV. Practical Operational Considerations
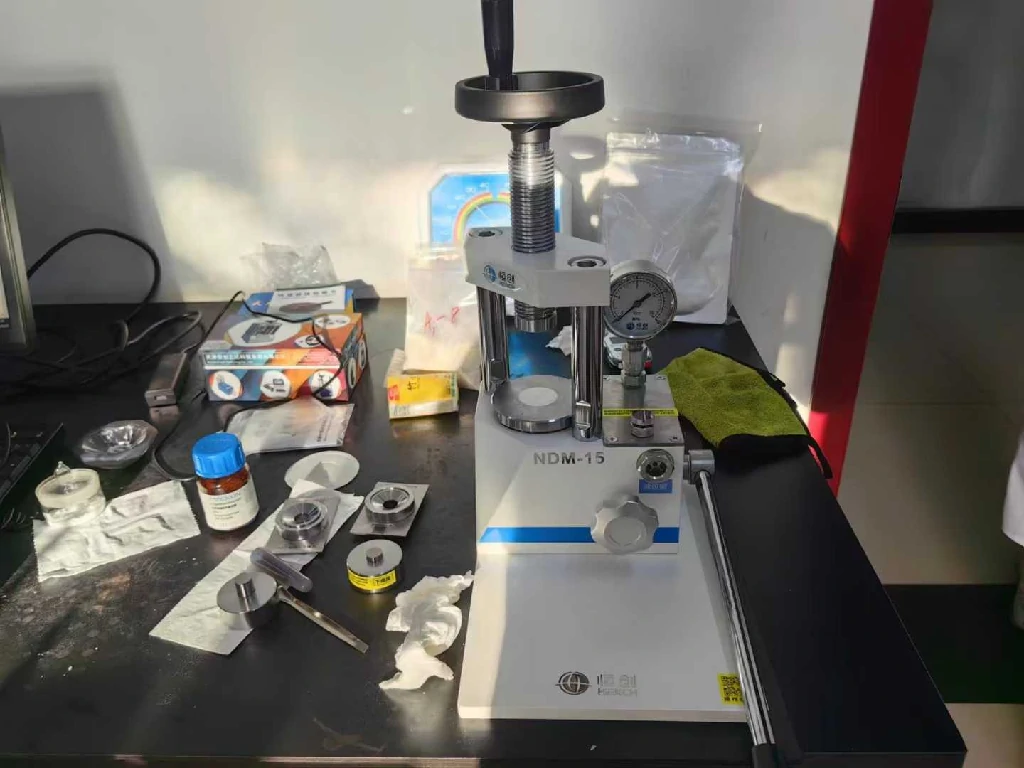
4.1 Sample Preparation
- Solid samples: Use spectral-grade KBr (≥99.99%), grind to <2 μm, press into transparent, crack-free pellets.
- Liquid samples: Use fixed-path liquid cells (NaCl/KBr), avoid turbidity, ensure consistent optical path.
- Gas samples: Use sealed chambers with controlled path length, purge with high-purity N₂ to remove moisture and air.
4.2 Instrument Calibration and Maintenance
- Calibrate wavenumber with polystyrene film; maintain error < ±1 cm⁻¹.
- Use standard samples to verify optical path length.
- Regularly clean optics, remove moisture/CO₂ interference, and check light source and detector status.
4.3 Spectral Processing
- Select strong, symmetrical, non-overlapping peaks.
- Perform baseline correction, smoothing, and peak area measurement for accurate quantification.

V. Advantages and Limitations
Advantages:
- Non-destructive; suitable for precious samples.
- Small sample volume required.
- Direct, efficient measurement without derivatization.
- Applicable to solid, liquid, and gas samples.
Limitations:
- Lower sensitivity compared to UV-Vis spectroscopy (0.01–0.1% detection limits).
- Peak overlapping in complex matrices may require deconvolution and peak fitting.
- Matrix-dependent; calibration curves must be prepared for each system.
VI. Summary and Outlook
The Beer–Lambert Law is fundamental to quantitative FTIR. Reliable application requires standardized operation, careful method selection, and error control. Advances such as micro-FTIR and ATR-FTIR enhance sensitivity and matrix tolerance. With proper laboratory practices, FTIR provides rapid, non-destructive, and precise quantitative analysis across chemistry, materials, pharmaceuticals, food, and environmental monitoring.
| Method | Principle | Advantages | Applications |
|---|---|---|---|
| Calibration Curve (External Standard) | Linear relationship between absorbance and concentration | Simple, low computational load | Single-component samples, water in solvents, alcohol impurities |
| Internal Standard | Use absorbance ratio of analyte to internal standard | Corrects preparation and instrument errors | Complex matrices, polymers, pharmaceuticals |
| Standard Addition | Add known analyte to sample to account for matrix | Eliminates matrix effects | Trace impurities in polymers, environmental water, residual monomers |
| Deconvolution & Peak Fitting | Separate overlapping peaks using software | Enables multi-component quantification | Copolymers, petroleum hydrocarbons, multi-component organics |

